Contents
- 1 Collective Mind CMD demos
- 2 On-going projects
- 3 Collective Mind web-based demos
- 3.1 Program multi-objective auto-tuning with Paretto-like filtering (compiler optimizations)
- 3.2 Program crowd-tuning using available Android mobiles or cloud services (compiler optimizations)
- 3.3 Universal program/architecture parameter exploration for modeling and adaptation
- 3.4 Optimization prediction using collective knowledge about program/architecture properties
Collective Mind CMD demos
We expect that users at least briefly read Collective Mind intro, user guide and possibly long-term vision paper. Since 1999, when started working on program and architecture auto-tuning, machine learning and co-design, we faced numerous problems including huge optimization spaces, ever changing tools and their interfaces, lack of mechanisms and repositories to preserve and exchange design and optimization knowledge apart from numerous publications where reproducibility is often not even considered. Therefore, we are trying to develop a community-driven integrated framework and repository (cTuning since 2007 and Collective Mind since 2011) to deal with all these problems and enable collaborative, systematic and reproducible research and exprimentation in computer engineering through customizable experimental pipelines while still focusing on top-down auto-tuning (starting from algorithm tuning, high-level source-to-source optimizations, compiler flags, fine-grain compiler transformations, etc), machine learning and crowdsourcing.
Below is a brief description of available command-line based demos for Collective Mind on compiler flag tuning and program dataset behavior exploration. Related scripts can be found in the $CM_ROOT/scripts/2-examples-of-auto-tuning. We currently support various versions of GCC, LLVM, ICC, Open64 and related libraries for Linux, Windows and Android that can easily co-exist with each other in cM repositories, and can be collaboratively extended.
"Build and run" experimental pipeline
Here we describe how to use our current common "build and run" experimental pipeline (directory $CM_ROOT/scripts/2-examples-of-auto-tuning/1-basic-build-and-run). Associated cM code for this pipeline can be found in $CM_ROOT/default/.cmr/module/ctuning.pipeline.build_and_run_program/module.py. It connects all the related artifacts from repository such as source code, data set, compiler, profiling tools (gprog, Intel vTune, likwid), OS, processor, etc. or chain other modules (such as statistical analysis of characteristics, Pareto frontier filter, etc) to build, run program and measure/collect related characteristics such as execution time, code size, compilation time, correctness of the output, hardware counters, etc. Input is customized through cM json file or command line parameters (which are internally converted to json). Output is also recorded as json format. Internally json is directly converted to python dictionary.
Note that these demos are available in the standalone Collective Mind package and do not require downloading of extended cTuning data from the live Collective Mind repository (though it will enable much more functionality, packages, benchmarks and data sets).
First, user can list available artifacts:
- list_oses.bat - should show supported Operating Systems in Collective Mind (descriptions provided by community). OS entries can be found in $CM_ROOT/repos/default/.cmr/os.
- list_processors.bat - lists supported processors. Processors entries can be found in $CM_ROOT/repos/default/.cmr/processors.
- list_codelets_and_benchmarks.bat - lists all available benchmarks, codelets and kernels in Collective Mind local repositories. Benchmark entries can be found in $CM_ROOT/repos/ctuning-shared/.cmr/code.source.
- list_datasets.bat - lists all available data sets. Dataset entries can be found in $CM_ROOT/ctuning-shared/.cmr/dataset.
- list_packages.bat - lists all available package (Collective Mind provides a mechanism to share packages with their unified installation scripts to be able to preserve the whole experimental setup for reproducibility and enable easy co-existance of multiple version of tools (such as compilers)). For now, the easiest way to install packages is through user-friendly cM Web interface (cM Web front end -> Usage -> Install/monitor packages). Packages entries can be found in $CM_ROOT/ctuning-shared/.cmr/package.
- get_installed_packages.bat - lists all installed packages (binaries are installed inside repository under module 'code'). Installed code entries (packaged, libraries, etc) can be found in $CM_ROOT/default/.cmr/code.
- get_installed_compilers.bat - lists all installed compilers for your cM installation (by default, cM includes pre-installed packages for "generic GCC" and "generic LLVM" compilers to be able to run further demos without any installations).
- get_compiler_descriptions.bat - lists all available compiler descriptions (mainly flags required for later auto-tuning). Compiler descriptions entries can be found in $CM_ROOT/ctuning-shared/.cmr/ctuning-shared.
Now, user can test "build and run" pipeline. For example, use run_pipeline_linux_gcc.bat to compile and run benchmark susan corner detection (benchmark-cbench-automotive-susan-demo) with a pgm picture as a dataset (image-pgm-0001-demo) and generic GCC with -O3 flag. Normally, if everything is installed correctly, at the end of pipeline execution user will see a list of measured characteristics.
Execution of this pipeline can be easily customized through self-explanatory json input file (run_pipeline_linux_gcc.json). It currently has the following variables:
{
- "tuning_repo_uoa":"ctuning-shared", working repository to find, build and run benchmark in
- "compiler_package_name":"gcc generic", # selects compiler package name
- "compiler_fuzzy_match":"yes", # can find package with incomplete name
- "prune_program_by_class":"dc6b904ae894e1cb", # internal info
- "program_uoa":"benchmark-cbench-automotive-susan-demo", # selects benchmark
- "run_cmd_key":"corners", # selects available command line to run benchmark
- "dataset_uoa":"image-pgm-0001-demo", # selects data set (cM automatically finds associated data sets for a given program based on classes, i.e. image pgm)
- "print_build_and_run_params":"no", # prints available build parameters (including data set parameters such as matrix size, etc)
- "compilation_type":"dynamic", # selects compilation type
- "compile_script":"build_dynamic_bin_c", # select compilation script (can be found in $CM_ROOT/repos/default/os.script
- "force_compile_flags":"-O3", # select compiler flag
- "skip_compile_output_redirect":"yes",
- "use_likwid":"no", # use likwid tool to collect hardware counters (we include likwid packages in the ctuning-shared repository to demo installation though cM)
- "likwid_package_name":"likwid 3.0.0 with",
- "likwid_fuzzy_match":"yes",
- "use_vtune":"no", # use Intel vTune tool to collect hardware counters (in case, user have already installed Intel vTune, we provide a package to configure Intel vTune through cM)
- "vtune_package_name":"vtune",
- "vtune_fuzzy_match":"yes",
- "use_perf":"no", # use perf tool to collect hardware counters (we recently found strange and non-reproducible behavior so currently we suggest to use likwid)
- "repeat_for_statistics":"2", # number of repetition of the pipeline for statistical analysis (both build and run since we use pipeline for both program analysis and compiler improvements)
- "statistics_module":"ctuning.filter.variation", # statistical module that is chained at the end of the pipeline to analyse measured characteristics (such as validating normality - requires R). Module can be found in $CM_ROOT/repos/default/module/ctuning.filter.variation or $CM_ROOT/repos/default/module/math.variation, etc).
- "only_prepare_state":"no", # instead of running pipeline, only initialize pipeline state (needed for later scenarios on iterative compilation, auto-tuning etc where this pipeline will be reused across iterations)
- "suppress_output_when_running_pipeline":"yes", # suppress all output when running pipeline except CMD tools (useful for demos to avoid too much output)
- "output_state_after_running_pipeline":"no",
- "record_state_before_running_pipeline_to_file":"tmp_pipeline_input.json", # record pipeline state before execution to file as json
- "record_state_after_running_pipeline_to_file":"tmp_pipeline_output.json", # record pipeline state after execution to file as json
- "output_known_characteristics":"yes",
- "save_results_to_ctuning_space_uoa":"demo-cmd-linux-run-gcc" # aggregate experiment results (input and output of a pipeline) to cTuning space for later reproducibility, visualization or sharing. cTuning space entries can be found in $CM_ROOT/ctuning-shared/.cmr/ctuning.space or can be listed using provided script list_ctuning_space.bat.
}
By default cM uses host OS, target OS and target processor as detected/provided during cM installation. To change them (for example to target Android devices with ARM processors while using Windows as host), user can provide the following variables to the above json file (as shown in script run_pipeline_android_gcc.bat and associated json file run_pipeline_android_gcc.json):
{
"host_os_uoa":"windows-generic-64",
"target_os_uoa":"android-generic-32",
"target_processor_uoa":"generic-arm"
}
Multi-objective compiler auto-tuning
Research and experimental scenarios such as auto-tuning are implemented in Collective Mind as standard modules (plugins) around above universal "build and run" pipeline. However, before sharing stable scenario as a cM module, it can be first prototyped and implemented outside as a python module. The names of such prototype modules always start with cme (Collective Mind External module) and have a direct access to Collective Mind API. Directory $CM_ROOT/scripts/2-examples-of-auto-tuning/2-tune-compiler-flagspresents such compiler flag auto-tuning scenario with a module cme.scenario.explore_compiler_flags.py . As a demo, user can run script run_scenario_explore_compiler_flags_linux_gcc_1.bat to explore based flags (-Ox) for susan corners benchmark and generic GCC. This scenario can also be customized through json input file (run_scenario_explore_compiler_flags_linux_gcc_1.json
{
"prepare_state":
{
- ... # "build and run" pipeline customization from the above example
- "save_results_to_ctuning_space_uoa":"demo-cmd-linux-gcc-1" # experimental results will be save in cTuning space with entry name demo-cmd-linux-gcc-1
},
- "ctuning_compiler_uoa":"gcc-4.7.x-shorter-and-no-graphite", # compiler description including optimizaiton flags for iterative compilation/auto-tuning. Entry can be found in $CM_ROOT/repos/ctuning-shared/ctuning.compiler.
- "number_of_iterations":"5", # number of iterations for auto-tuning
- "check_base_flags":"yes", # explore all base flags first (-Ox)
- "remove_base_flags_from_combination":"yes", # remove base flag from randomly generated combination of flags (useful for LLVM when tuning with opt)
- "calibrate_kernel":"yes", # if benchmark supports calibrarion of execution time, calibrate it (it's a loop around most time consuming kernel or main function with an upper bound defined through environment variable CT_REPEAT_MAIN).
- "check_output":"yes", # check output of a program including generated files (such as output images) for correctness. The first auto-tuning iteration is always with -O3 flag when output is recorded and compared with outputs from next iterations.
- "random_seed_number":"12345" # random seed number to reproduce generated solutions (combinations of flags)
}
Normally, all experimental results (pipeline characteristics vs combinations of compiler flags) will be saved to cTuning space entry demo-cmd-linux-gcc-1.
Next, user can run script run_scenario_explore_compiler_flags_linux_gcc_2.bat to explore 49 random combinations of flags (and -O3) and record experimental results to demo-cmd-linux-gcc-2.
Note, that there are two prepared similar demo scripts for LLVM, i.e. run_scenario_explore_compiler_flags_linux_llvm_1.bat and run_scenario_explore_compiler_flags_linux_llvm_2.bat .
We are currently extending this plugin to remove all points outside Pareto frontier on the fly (already available but needs some optimization).
Dataset exploration
An important part of program (or compiler) auto-tuning and run-time adaptation, is understanding and optimizing program behavior across multiple data sets (see Finding representative sets of optimizations for adaptive multiversioning applications, MiDataSets: creating the conditions for a more realistic evaluation of Iterative optimizations, Evaluating iterative optimization across 1000 datasets, Collective optimization: A practical collaborative approach). Therefore, we provided demo scripts available in the directory '$CM_ROOT/scripts/2-examples-of-auto-tuning/3-explore-datasets to monitor behavior of programs (benchmarks, codelets) vs datasets and their parameters.
Example run_scenario_explore_datasets_linux_gcc.bat explores behavior of a numerical benchmark LU (benchmark-polybench-cpu-lu-demo) from polybench collection versus matrix size (specified as a build parameter N and selected randomly during iterations) using GCC with -O3 flag while monitoring CPI and instruction count using likwid tool to collect hardware counters. Similar to auto-tuning scenario, this scenario is implemented as an external cM plugin cme.scenario.explore_datasets.py and can be customized through input json file run_scenario_explore_datasets_linux_gcc.json. Experimental results are continuously aggregated in cTuning space entry demo-cmd-dataset-linux-gcc.
We are gradually and collaboratively improving this plugin to support adaptive probabilistic sampling of large and multi-dimensional data set and optimization spaces to focus search on areas with an unusual behavior or highest speedup (concept described in Probabilistic source-level optimisation of embedded programs, Using Machine Learning to Focus Iterative Optimization and Collective optimization: A practical collaborative approach), and to find representative data set/optimization pairs to build adaptive applications through static multi-versioning and optimized decision trees that select appropriate versions at run-time using OpenME interface (as described in our paper).
Universal visualization of multi-dimensional spaces
Collective Mind enables universal visualization of multi-dimensional spaces generated by cM scenario plugins which are usually recorded as cTuning space entries. We prepared several demos available in directory '$CM_ROOT/scripts/2-examples-of-auto-tuning/4-visualize to visualize:
- 2D optimization space from compiler flag auto-tuning (such as execution time versus compilation time critical for companies developing mobile and embedded systems). Script view_ctuning_space_for_compiler_tuning_linux_gcc.bat plots such a graph for cTuning space entry demo-cmd-linux-gcc-1 after iterative compilation from one of the above demos.
- 2D graph of a program behavior (CPI) vs matrix size (N). Script plot_2d_graph_datasets_linux_gcc.bat plots such a graph for cTuning space entry demo-cmd-dataset-linux-gcc from one of the above demos.This script can be customized through plot_2d_graph_datasets_linux_gcc.json to select different graph engines with cM entries and dimensions to visualize.
Note, that the same graphs can be plotted from cM web interface (cM web interface -> Usage -> Build graph of multi-dimensional optimization space).
Reproducibility
One of the major purposes of the first cTuning framework and its third generation presented here (Collective Mind) was to enable reproducibility of experimental results to be shared and validated by the community. Since Collective Mind can preserve the whole experimental setup and all related material (artifacts) while unifying input and output of all modules (plugins) through json files, it is possible to easily replay recorded experiments from cTuning spaces while monitoring varying output parameters.
We preared a simple demo in directory '$CM_ROOT/scripts/2-examples-of-auto-tuning/5-reproduce to replay recorded experiment 0 for:
- compiler flag exploration from cTuning space entry demo-cmd-linux-llvm-1 (script reproduce_experiment_flags_linux_llvm.bat)
- dataset exploration from cTuning space entry demo-cmd-dataset-linux-gcc (script reproduce_experiment_datasets_linux_gcc.bat).
Note, that this mode is useful for compiler developers when using cM to test compiler performance, code size and compilation time regressions or bugs, sharing setups across specialists and reproducing problematic cases.
Miscellaneous scripts
We prepared a few more demo support scripts available in the directory '$CM_ROOT/scripts/2-examples-of-auto-tuning/6-misc:
- del_ctuning_space.bat - delete (clean) cTuning space entries from the above demos
- prepare_experiment_repo.bat - above demos run experiments in the ctuning-shared repository. However, it is often desirable to keep original repository and benchmarks "clean". Therefore, it is possible to copy all benchmarks to another ctuning-experiments repository using this script and changing 'target_repo_uoa="ctuning-experiments"' in the above input json files.
On-going projects
The following demos are for on-going projects and may not be stable. They require preparation of training sets using crowd-tuning through cM web based interface or Collective Mind node.
Crowdsourcing compiler flags tuning
Tuning of compiler flags was not solved in decades even with machine learning compiler (MILEPOST GCC) mainly because it requires huge amount of training runs. Having common infrastructure, we are trying to solve this problem using crowdsourcing. We provided a scenario where users can start experiments with just a few clicks on their machine, cloud service, supercomputer or even mobile phone or tablet (download and try Android application "Collective Mind Node" from Google Play Store) and submit experimental data to the common repository (c-mind.org) to find most profitable optimizations for different platforms, OS, compilers, programs and datasets. It is an on-going work and collaborations are appreciated!
Predicting optimizations and run-time adaptation using collective knowledge (on-going, a bit complex)
When enough knowledge is collected about program/codelet and architecture behavior and optimization, it is possible to predict optimizations or run-time adaptation scenarios using relatively standard machine learning techniques (predictive models) that correlate program static features (semantic MILEPOST features, code patterns, control flow graphs), dynamic program and architecture features (hardware counters, micro-architecture independent features, etc), static architecture features (cache size, pipeline length, etc), OS features, etc.
We hope that community will gradually add many various existing ML models. As the first step, we added a concept of cM self-tuning compiler module (ctuning.compiler) and ctuning-cc/ctuning-cpp/ctuning-fortran scripts that can wrap up any existing compiler and predict compiler flags (or finer-grain optimizations using pragmas or OpenME interface) using semantic program features from MILEPOST GCC and nearest neighbour classifier to find best found optimizations by the community for the most similar program/codelet in the repository.
The live interactive demo is available at c-mind.org. This online web-service is used in ctuning-cc to predict optimizations on the fly during compilation. Simply prefix your compiler with ctuning-cc and you will be able to control various options, record compilation flow for reproducibility, extract features, predict optimizations simply by controlling related environment variable and json file.
In order to test use ctuning-cc locally, you need to:
- Go to cM web front end -> Usage -> Install package
- Install MILEPOST GCC
- Install cTuning CC
- Install XBS
- We suggest to install GCC 4.7.2 as reference compiler since there is already collected statistics on program/codelet optimization in c-mind.org
- Go to cM web front end -> Usage -> Predict optimizations
- Click on cTuning local setup -> Add
- Specify 'default' as internal alias (if configured for the fist time) and configure your system for optimization prediction
Now you should normally be able to use ctuning-cc. Find the entry with the demo in the repository using
cmx find demo:ctuning-cc-and-milepost-gcc-with-cm
This directory contains 3 sub-directories:
- susan - susan corners benchmark from cBench (uses batch script for compilation)
- bzip2-1.0.6 - bzip2 real application (uses Makefile for compilation)
- lapack-3.4.2 - lapack library (uses configure and Makefile for compilation)
Each directory has 2 subdirectories:
- cm_build_linux_gcc - demo for Linux
- cm_build_win32_gcc - demo for Windows
Each of the above directories has the following scripts:
- cm_build_ctuning_test_repository.sh - test c-mind.org repository access (you must be registered)
- cm_build_native.sh - compile program using native compiler
- cm_build_ctuning_transparent.sh - compile program using ctuning-cc
- cm_build_ctuning_record_compilation.sh - record compilation flow for reproducibility (input in cm_input_rc.json, output in cm_output_rc.json)
- cm_build_ctuning_select_collective_opt.sh - select some pre-defined optimization from the local repository (input in cm_input_sco.json, output in cm_output_sco.json)
- cm_build_ctuning_select_collective_opt_cmind.sh - select some pre-defined optimization from the c-mind.org repository (useful when sharing optimizations from the publications such as from our MILEPOST GCC paper and then checking/reproducing them) (input in cm_input_sco_cmind.json, output in cm_output_sco_cmind.json)
- cm_build_ctuning_extract_features.sh - extract program semantic features using MILEPOST GCC (input in cm_input_ef.json, output in cm_output_ef.json)
- cm_build_ctuning_predict_opt.sh - predict optimizations on the fly using local repository (input in cm_input_po.json, output in cm_output_po.json)
- cm_build_ctuning_predict_opt_cmind.sh - predict optimizations on the fly using c-mind.org repository (input in cm_input_po.json, output in cm_output_po_cmind.json)
Note: if GCC is not in your path (say on Windows) you need to add a call to cM package variable in scripts with installation UID (can be found on the right side of each package in cM web front-end -> Usage -> install package: . cm_code_env_<cM UID of package installation>.sh
Ctuning-cc/ctuning-fortran/ctuning-cpp and cM module ctuning.compiler is an example of cM universal tuning and learning concept. Basically instead of using
gcc -O3 *.c
user now writes:
cur_path=$PWD
export CM_CTUNING_COMPILER_CMD="ct_output_file=\"$cur_path/cm_output_po_cmind.json\" @\"$cur_path/cm_input_po_cmind.json\""
export CM_CTUNING_LOCAL_SETUP_UOA=default
ctuning-cc gcc -O3 ../*.c -o a.out -lm
where compiler can now continuously learn and improve optimization heuristics based on collective knowledge. Note, that default is the UOA of the cTuning local setup that user prepared above.
Naturally, there is much more to be done in the future and we hope to improve/extend this technology collaboratively, including run-time adaptation based on our past techniques (static multi-versioning combined with machine learning and run-time adaptation dynamic plugins using OpenME interface) - see our possible collaborative projects and the following publications FCOP2005 LCWP2009 JVGP2009 FT2010:
http://ctuning.org/cm/wiki/images/1/19/Cm_run_time_adaptation.png
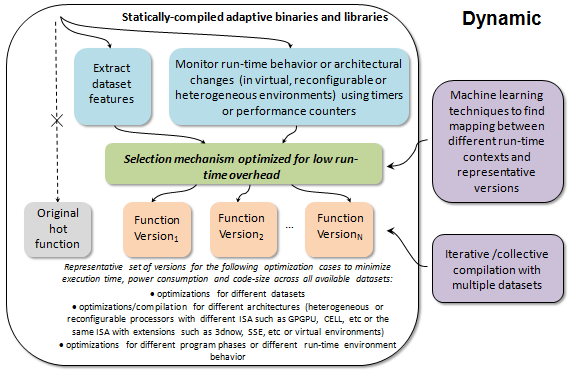
Collective Mind web-based demos
In 2013, we deprecated our previous cTuning1 public repository (opened in 2008), and opened a new live Collective Mind repository at c-mind.org/repo. Any user can self-register and access the latest public codelets, benchmarks, datasets, packages, models, experimental data shared by the community. Users can also rank existing data or upload their own data (an on-going work to make it more intuitive and user-friendly).
Here we collect some demos at the live c-mind.org server to give users some ideas about what cM can do or help with (note that user can reproduce these actions locally using cM as described in detail in cM user guide.
Platforms, approximate power consumption and costs of platforms (2013/May) used for demos (watts for laptop were measured with the off-the-shelf power meter, cM running susan corners benchmark in a loop, and with max frequency):
| |
Approximate power consumption (max) |
Approximate cost |
Description |
| P1=Samsung Galaxy Y |
~4 Watts |
~100 euros |
Broadcom BCM21553 ARM11 processor (ARMv6), 0.832 GHz, Memory 290MB |
| P2=Archos 101IT |
~7 Watts |
~140 euros |
ARM Cortex A8 single core 1GHz, L1=32KB, L2=512KB |
| P3=Dell Latitude D630 |
~46Watts |
~180 euros |
Intel Core2 Centrino T7500 2.2GHz, Merom, L1=32KB 8-way set-associative, L2=4MB, 16-way set associative |
| P4=Dell Latitude E4300 |
~50 Watts |
~200 euros |
Intel Core2 Duo Centrino P9400 2.4GHz, Penryn, L1=32KB, 8-way set associative, L2=6Mb, 24-way set associative, Memory=DDR3 4Gb, Dual 530MHz |
| P5=Dell Latitude E6320 |
~52 Watts |
~800 euros |
Intel Core i5 2540M 2.6GHz, Sandy Bridge, L1=32KB 8-way set associative, L2=256KB 8-way set associative, L3=3MB, 12-way set associative, Memory DDR3 dual channels, 8GB, 665MHz |
Program multi-objective auto-tuning with Paretto-like filtering (compiler optimizations)
- Graph: Analysis of execution time variation (susan corners benchmark, Intel i5 processor, high-performance power scheme, 30 repetitions)
- Graph: Analysis of execution time variation (susan corners benchmark, Intel i5 processor, power scheme changed from max to min performance, 30 repetitions)
- Graph: compiler tuning (susan corners benchmark, Samsung Galaxy Y mobile, ARM v6, Sourcery GCC 4.7.2, 100 exploration points with random flags, kernel execution time vs binary size(
- Graph: compiler tuning (susan corners benchmark, Samsung Galaxy Y mobile, ARM v6, Sourcery GCC 4.7.2, 100 exploration points with random flags, kernel execution time vs binary size) - multigraph with references optimizations separated (-O1,-O2,-O3,-Os, -fast,etc)
- Graph: compiler tuning (susan corners benchmark, Samsung Galaxy Y mobile, ARM v6, Sourcery GCC 4.7.2, Pareto fronteer after 100 exploration points with random flags, kernel execution time vs binary size) - multigraph with references optimizations separated (-O1,-O2,-O3,-Os, -fast,etc)
- Graph: compiler tuning (susan corners benchmark, {Samsung Galaxy Y mobile, ARM v6 vs Archos 101 Internet Tablet, ARM v7}, Sourcery GCC 4.7.2, Pareto frontier after 100 exploration points with random flags, kernel execution time vs binary size) - multigraph with references optimizations separated (-O1,-O2,-O3,-Os, -fast,etc)
- Graph: compiler tuning (susan corners benchmark, Samsung Galaxy Y mobile, {Sourcery GCC 4.7.2 vs 4.6.3}, Pareto frontier after 100 exploration points with random flags, kernel execution time vs binary size) - multigraph with references optimizations separated (-O1,-O2,-O3,-Os, -fast,etc)
- Graph: compiler tuning (susan corners benchmark, Archos 101 Internet Tablet, {Sourcery GCC 4.7.2 vs LLVM 3.1}, 100 exploration points with random flags, kernel execution time vs binary size) - multigraph
Note, that above graphs can be easily converted to pdf, eps or png for publications or presentations - just press the associated button (when using Python MatplotLib as Graph engine).
Program crowd-tuning using available Android mobiles or cloud services (compiler optimizations)
As the first public crowd-tuning scenario of computer systems, any self-registered user can participate in systematizing of compiler flag tuning for multiple objectives on their own laptops, desktops and cloud/GRID services using standard cM framework, or using "Collective Mind Node" client on any mobile phone or Tablet with Android >= 2.x. Latest tuning results can be viewed here - currently we validate our past research and use data mining and machine learning to analyse this data and correlate most profitable compiler flags with program and architecture features. This is an on-going work and collaborations are welcome (we plan to continue collaborative development of such scenarios).
- Android application: Collective Mind Node to crowd source auto-tuning (current example - compiler flags tuning)
- Table: most profitable compiler flags found by the community (from mobiles, cloud services, etc)
Universal program/architecture parameter exploration for modeling and adaptation
We can easily perform tuning of various dimensions in our experimental pipeline. For example, we analyze CPI vs dataset size (or any other dimension in the pipeline that is very useful for data mining) for the ludcmp numerical codelet on several Intel architectures using Intel vTune amplifier (the same can be done with perf):
- Graph: P5
- {Graph: P3 vs P5}
- {Graph: P3 vs P4} - note alignment misses that relates to cache hierarchy
Note that these graphs motivate our run-time adaptation solution for heterogeneous architectures (servers, supercomputers, clouds) when depending on the code and dataset parameters, it's faster or more power efficient to run them on different processors or with different frequency. It is based on static multi-versioning and dynamic run-time adaptation schemes as described in FCOP2005 LCWP2009 JVGP2009 FT2010, and we plan to add these support for adaptive scheduling of CPU/CUDA/OpenCL kernels using cM in the future (see out future possible collaborative projects):

Optimization prediction using collective knowledge about program/architecture properties
Ctuning-cc/ctuning-fortran/ctuning-cpp demos (cM universal tuning and learning compiler wrapper) to predict compiler optimizations on the fly are available in cM and described in cM user guide.
If you would like to add (or see) more demos, please get in touch!